GEOTECHNICAL ENGINEERING1
SWINDON
HomeLaboratoryGrain size analysis (sieve + hydrometer)

Particle Size Distribution Analysis for Swindon Construction Sites

Practical geotechnics, field-tested.

LEARN MORE

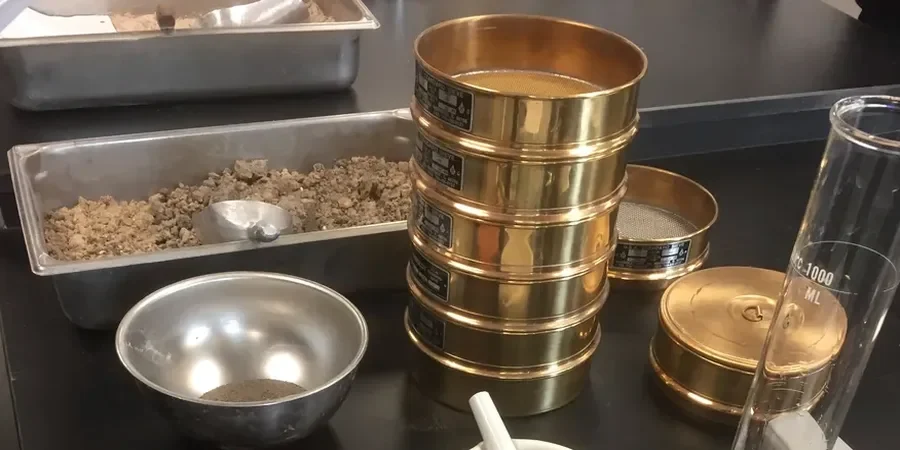
Around Swindon, we see a lot of projects delayed because the ground report stops at a visual classification. A look at the soil with the naked eye tells you almost nothing about how it drains, compacts, or holds a load over time. The real story is in the gradation curve. Whether you are working on a greenfield site near the A419 expansion, dealing with the stiff overconsolidated clays of the Kimmeridge formation, or screening granular fill from a quarry north of the M4, you need the full particle size distribution picture. A proper sieve analysis combined with a hydrometer test for the fines fraction is how we move from guesswork to defensible design parameters. For sites where the clay content is critical to earthworks specification, the gradation data often feeds directly into a triaxial shear test to nail down the effective stress strength envelope. This avoids the cost spiral of re-engineering after a failed compaction test. The BS 5930 code gives us the framework, but applying it to Swindon's patchwork geology is where local experience counts.

A single particle size curve reveals more about a soil's engineering behaviour than a thousand visual descriptions.
Our service areas

Process and scope

BS 5930:2015+A1:2020 and Eurocode 7 require particle size distribution as the starting point for any soil classification. In Swindon, this becomes particularly relevant because of the transition soils you encounter between the Oxford Clay vale and the Corallian limestone ridge. A sample taken at 3 metres in one borehole might be a well-graded sandy GRAVEL, while fifty metres away you hit a silty CLAY with intermediate plasticity. Without the full curve from the 63 mm sieve down to the 2-micron hydrometer reading, you cannot reliably assign the soil group, and that means your bearing capacity assumptions are on thin ice. Our laboratory runs the wet sieving and sedimentation hydrometer analysis as a single integrated procedure, reporting Cu and Cc coefficients that let the geotechnical engineer spot gap-graded materials instantly. When the fines content pushes above 35%, the Atterberg limits test becomes the natural next step to confirm whether you are dealing with a silt that drains or a clay that holds water for months. For road subgrade evaluation along routes like Thamesdown Drive, checking the gradation against the CBR test specification saves the pavement design from over-conservatism or under-design.
Particle Size Distribution Analysis for Swindon Construction Sites
Technical reference — Swindon

Local considerations

Swindon sits on the northern edge of the Wessex Basin, where the Upper Jurassic Kimmeridge Clay Formation dominates much of the central and eastern areas. This clay can contain up to 55% fines, and the proportion of clay-sized particles versus silt-sized particles directly controls the shrink-swell potential that has damaged lightly-founded structures across the town. The British Geological Survey maps also show pockets of river terrace gravels along the Ray and Cole valleys, which are popular borrow sources but often contain unexpected lenses of soft alluvial silt. If you skip the hydrometer stage and only run a coarse sieve stack, you miss the 15-20% sub-63-micron fraction that makes that gravel unsuitable as free-draining backfill behind a retaining wall. The risk is real: we have seen retaining structures on the Swindon side of the Cotswolds develop pore pressure problems because the drainage material was placed based on a visual estimate rather than a complete gradation analysis. When the particle size distribution confirms a high fines content in natural ground, combining the data with a slope stability analysis becomes essential for any cut deeper than 2 metres.

Need a geotechnical assessment?

Reply within 24h.

Email: contact@geotechnical-engineering1.com

Reference standards

BS 5930:2015+A1:2020 (Code of practice for ground investigations), BS 1377-2:2022 (Methods of test for soils – Classification tests), BS EN ISO 17892-4:2016 (Geotechnical investigation – Particle size distribution)

Reference parameters

ParameterTypical value
Test methodWet sieving + hydrometer sedimentation (BS 1377-2)
Sieve range75 mm to 63 µm (full stack)
Hydrometer range63 µm to 2 µm (clay fraction)
Reporting parametersD10, D30, D60, Cu, Cc, % gravel/sand/silt/clay
Sample mass500 g to 5 kg depending on max particle size
Dispersing agentSodium hexametaphosphate (Calgon)
AccreditationUKAS-accredited internal lab procedures

Questions and answers

What particle size range does a combined sieve and hydrometer test cover?

The combined analysis covers a range from 75 mm (coarse gravel) down to 2 microns (fine clay). The sieve stack handles material retained on the 63-micron sieve, while the hydrometer sedimentation test measures the silt and clay fractions passing the 63-micron sieve down to approximately 2 microns. This gives you the full particle size distribution curve needed for BS 5930 soil classification.

How long does a full gradation analysis take in the lab?

Standard turnaround for a complete sieve plus hydrometer analysis is 5 to 7 working days from sample receipt. The hydrometer stage requires a 24-hour sedimentation period at minimum, and the oven-drying and washing stages add time. We can expedite to 3 working days for urgent projects when arranged in advance.

What is the typical cost for a particle size distribution test in Swindon?

A full combined sieve and hydrometer analysis on a single sample typically falls between £90 and £150, depending on the maximum particle size and the number of hydrometer readings required. Bulk pricing is available for multi-sample site investigation programmes, and we include the classification report as standard.

Why is the hydrometer test necessary if I already have the sieve results?

The sieve analysis stops at 63 microns, which means it cannot distinguish between silt-sized particles (63 to 2 microns) and clay-sized particles (below 2 microns). This distinction is critical because clay minerals control plasticity, shrink-swell behaviour, and drainage. A gravel with 18% clay-sized fines will perform very differently from one with 18% silt-sized fines, even though both show the same percentage passing the 63-micron sieve.

Location and service area

We serve projects in Swindon and surrounding areas.

View larger map